KDU - Kawasaki Dealer University
The Problem:
Kawasaki Motor Corp. needed a new LMS platform that could grow and adapt to their changing sales and service demands for their staff across the country.
What they needed:
A system that could be customized using their branding, logos, colors, and fonts.
A system that they could add feature sets to down the road.
The ability to build custom reporting and the ability to adjust training based on current and future needs.
The need for custom integrations and APIs to connect with existing programs.
An interface that was both usable and scalable.
Technology that wasn’t going to be out of date in the near term.
They needed all of their previous users’ training data maintained and imported into the new platform.
Case Study - Enterprise LMS Solution
The Solution
How the solution was achieved:
We listened to what the client wanted.
We asked questions.
We listened again and gave our best suggestions based on years of expertise.
We figured out a pipeline that enabled us to give them 98% of what they wanted.
We worked closely with their 3rd party vendors to ensure a smooth transition
We mined 10 years of user, certification, and training data and treated it like it was our own.
We tested, tested and tested.
We regularly communicated and were open to ideas and criticism.
We had a clear idea and maintained our vision.
We were 100% successful because we treated the client like a partner.

The Original Sitemap
A sitemap is a visual or written outline that represents the organization of all key pages, sections, and user pathways within the LMS. It visually maps how users navigate between different modules, dashboards, and functionalities.
A sitemap isn't just helpful—it's critical for building a custom LMS. It ensures clarity, efficiency, scalability, and alignment between all stakeholders. Without it, the risk of scope creep, poor user experience, and costly redevelopment increases dramatically.

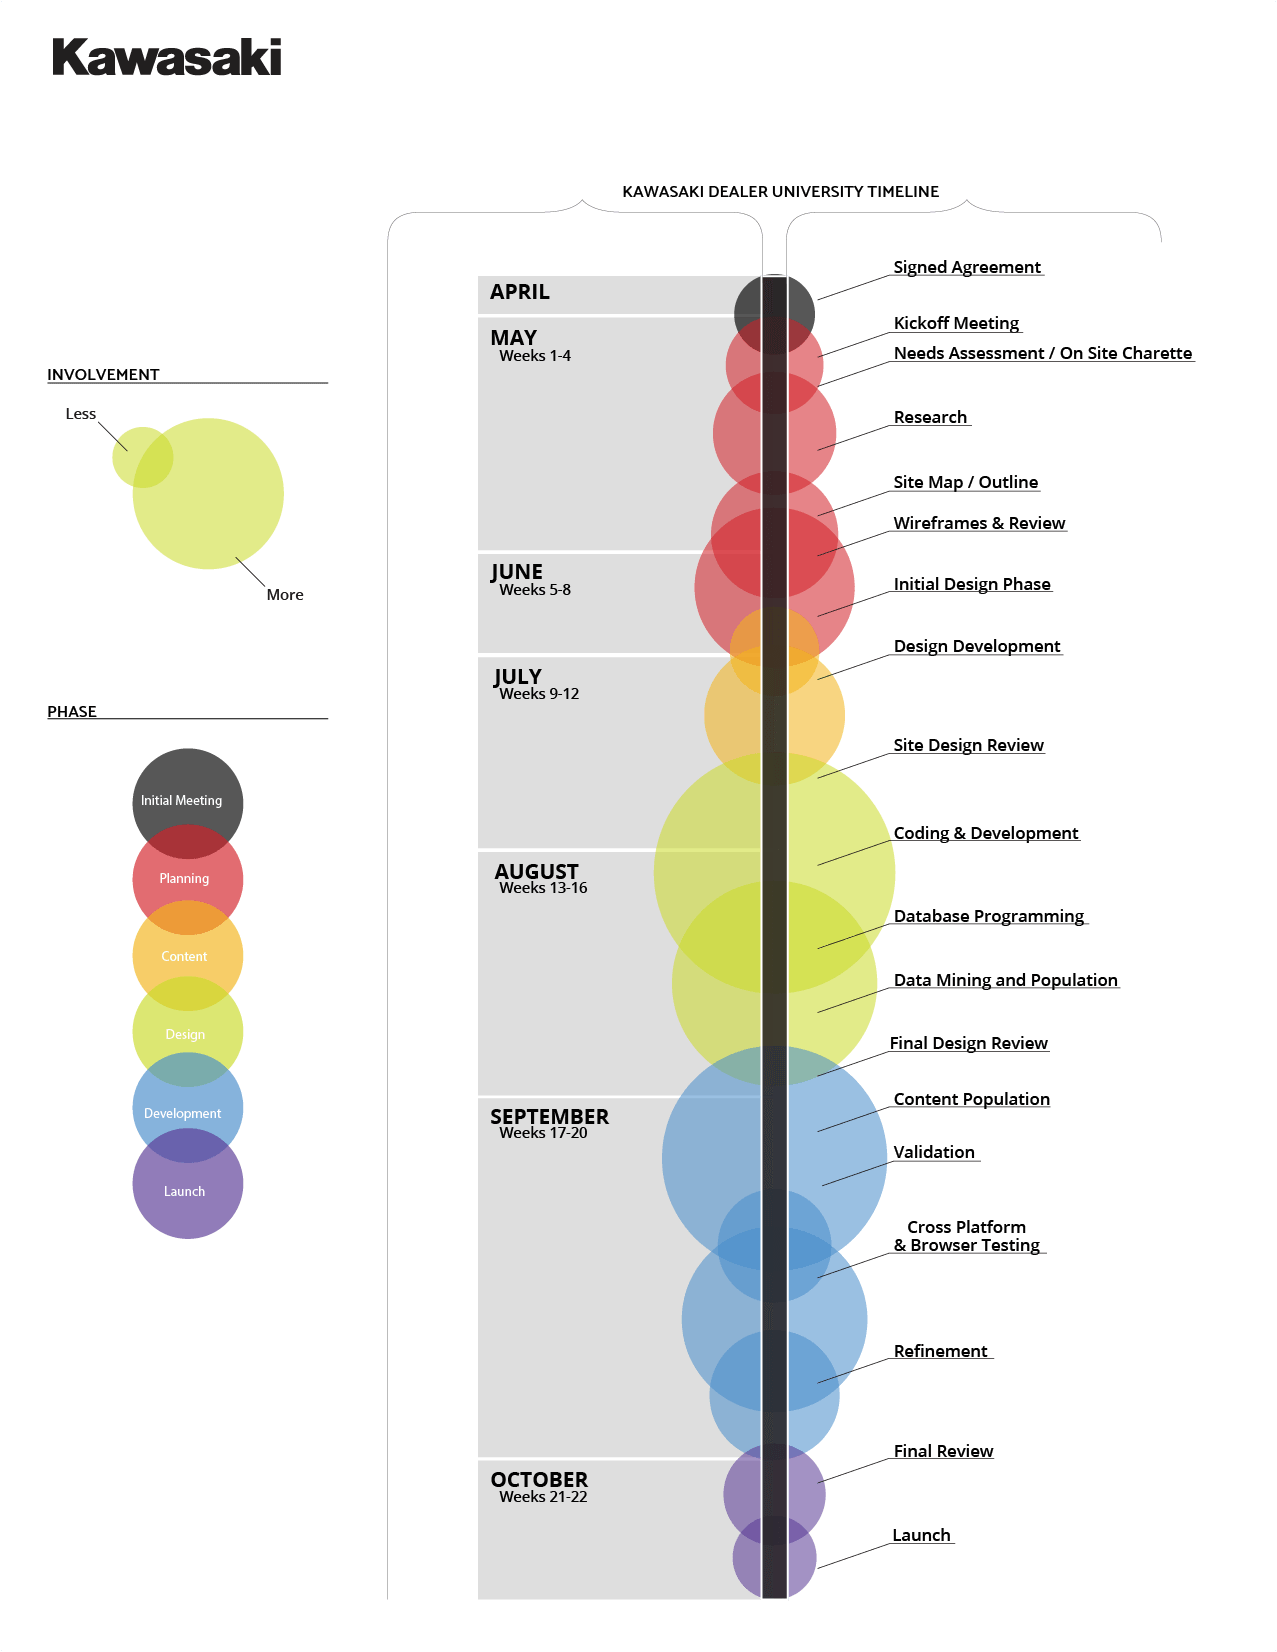
The Timeline
A timeline serves as a strategic roadmap that outlines the key phases, milestones, deliverables, and deadlines throughout the lifecycle of developing a custom Learning Management System (LMS). It is a structured plan that aligns all stakeholders—developers, designers, project managers, subject matter experts, and the client—around clear expectations and goals.
When creating a custom LMS, the timeline typically breaks the project into manageable phases such as:
Discovery & Requirements Gathering
System Architecture & Planning
UI/UX Design
Development & Engineering
Content Migration & Upload
Quality Assurance (QA) & Testing
Training & User Onboarding
Launch & Deployment
Post-Launch Support & Iterations
Each phase contains specific tasks, deadlines, dependencies, and checkpoints to ensure the project progresses smoothly.
A well-structured timeline is not just a project management tool — it’s a foundational element for the success of a custom LMS build. It transforms what could be a chaotic and overwhelming process into a clear, collaborative, and organized journey toward delivering a scalable, user-friendly, and high-performing learning platform.
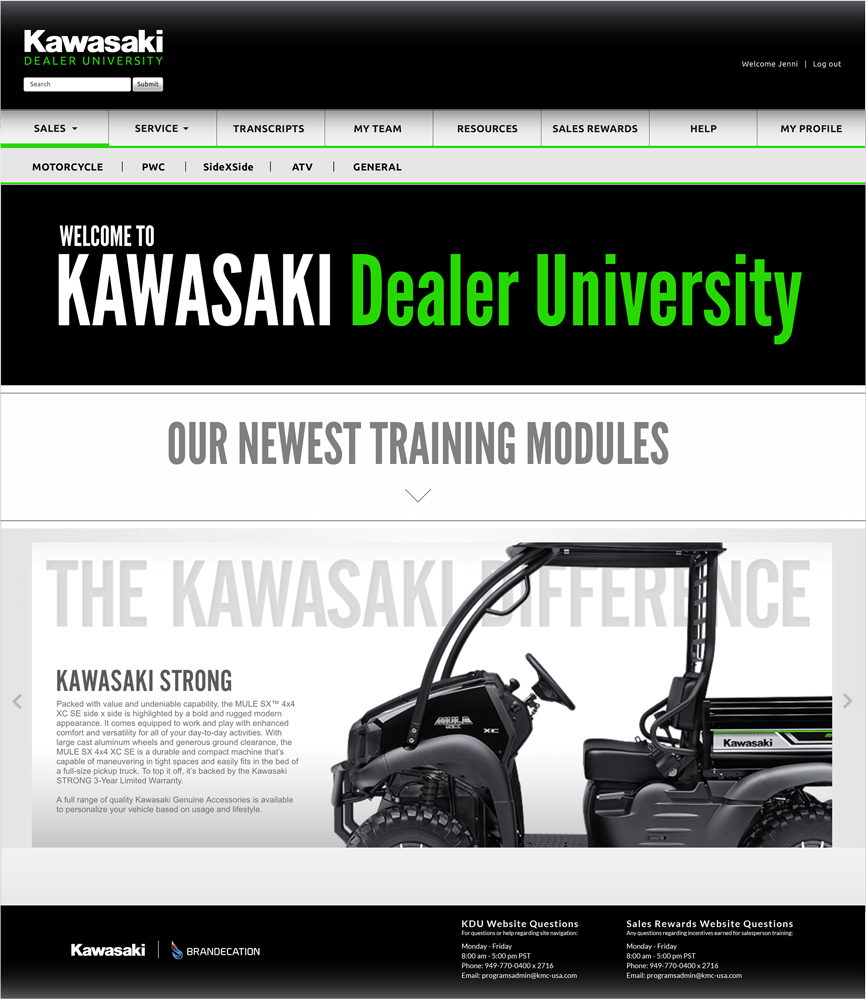
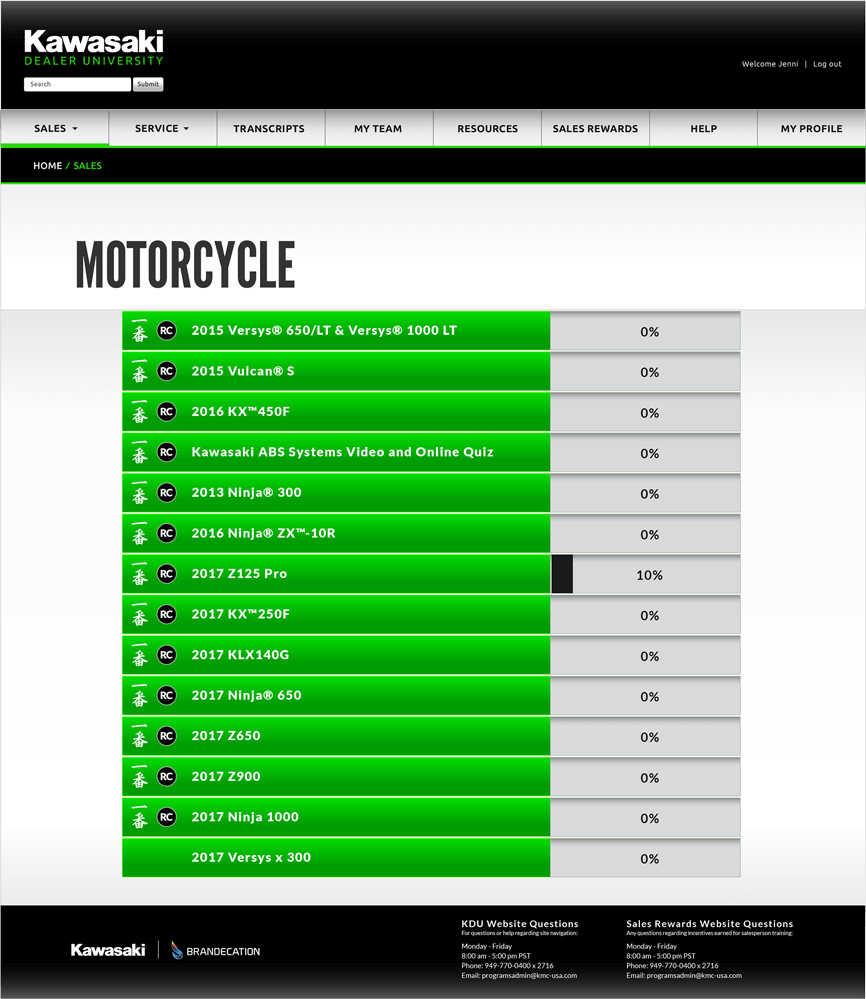
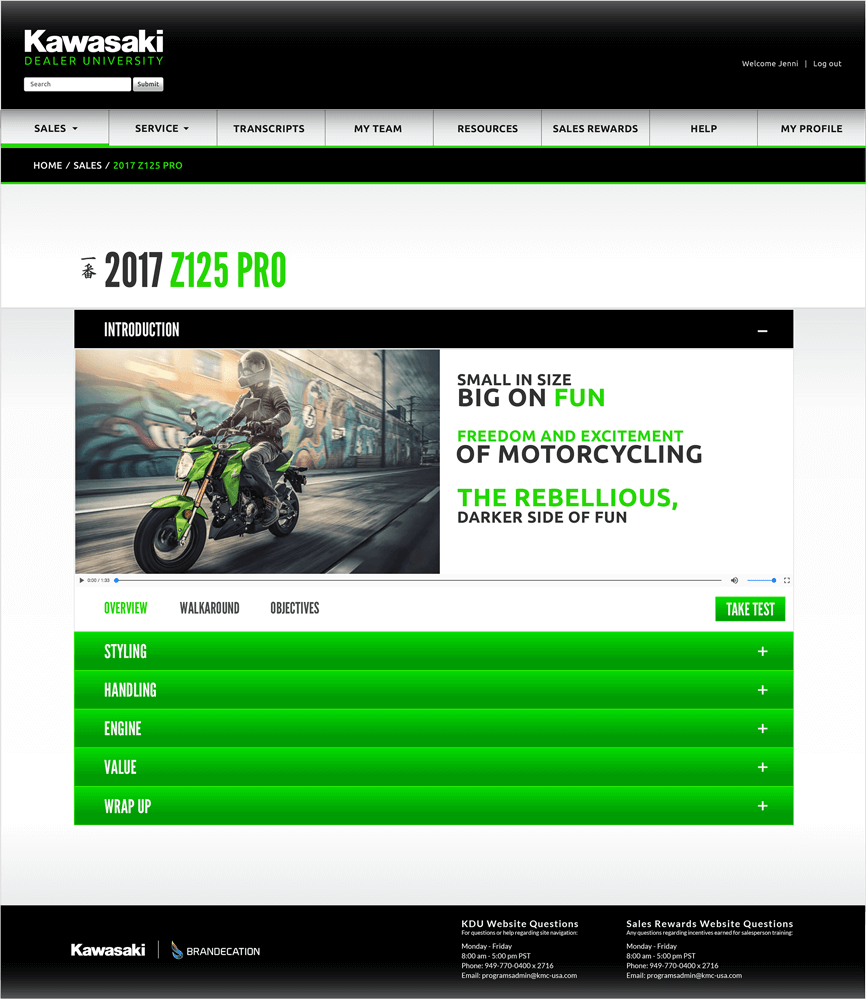
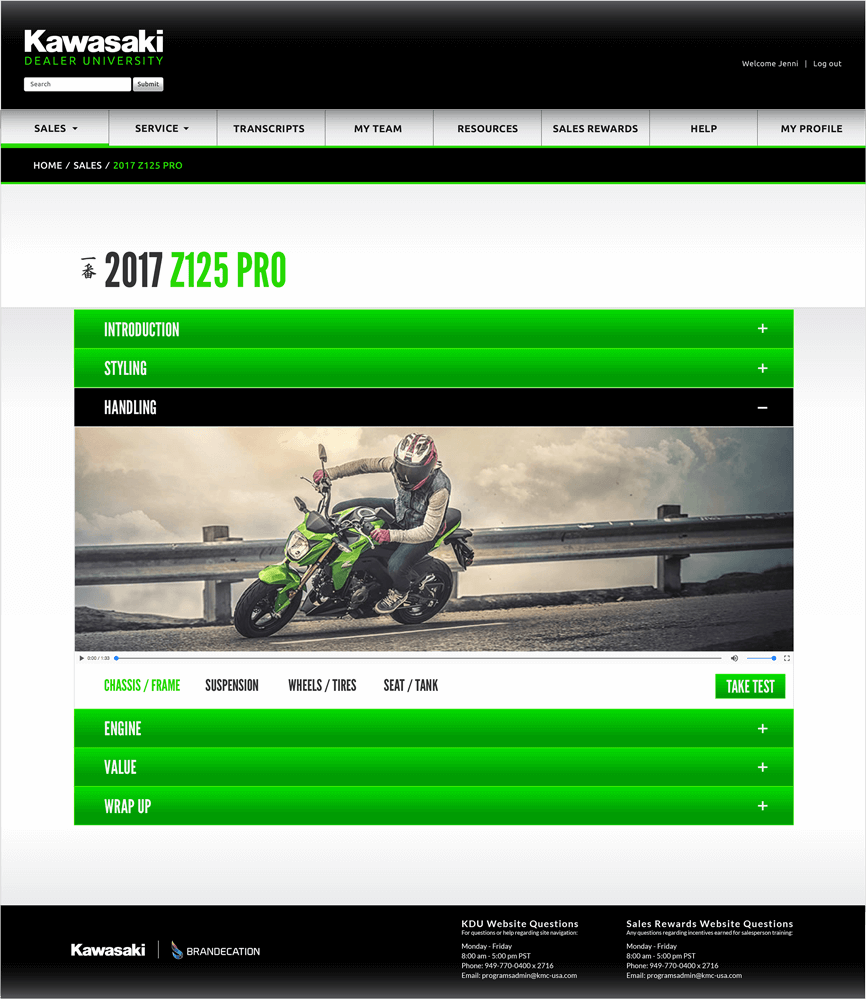
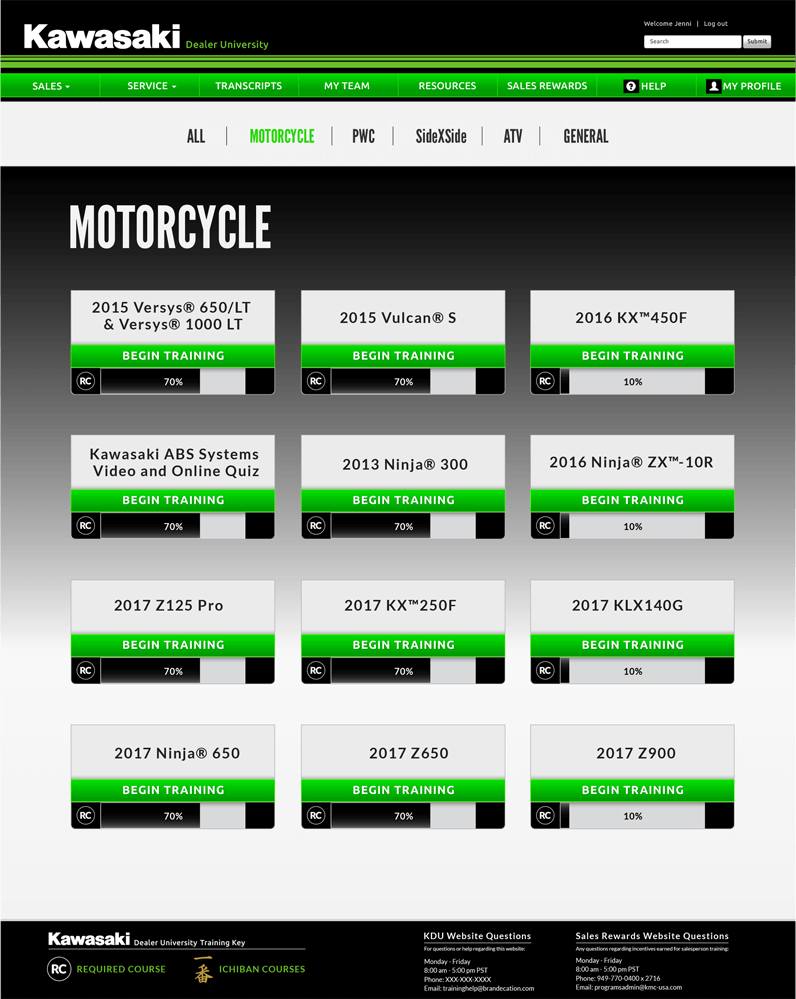
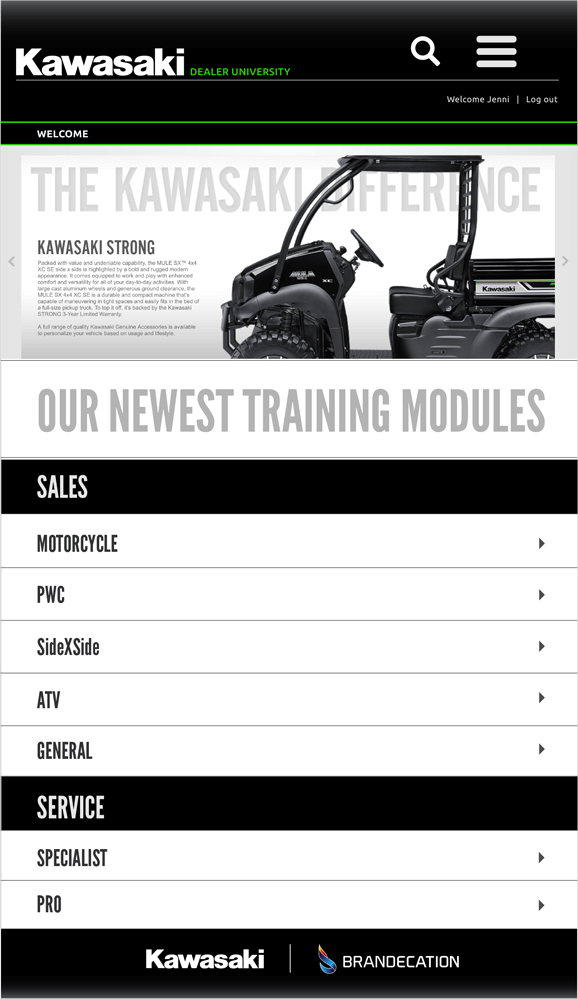
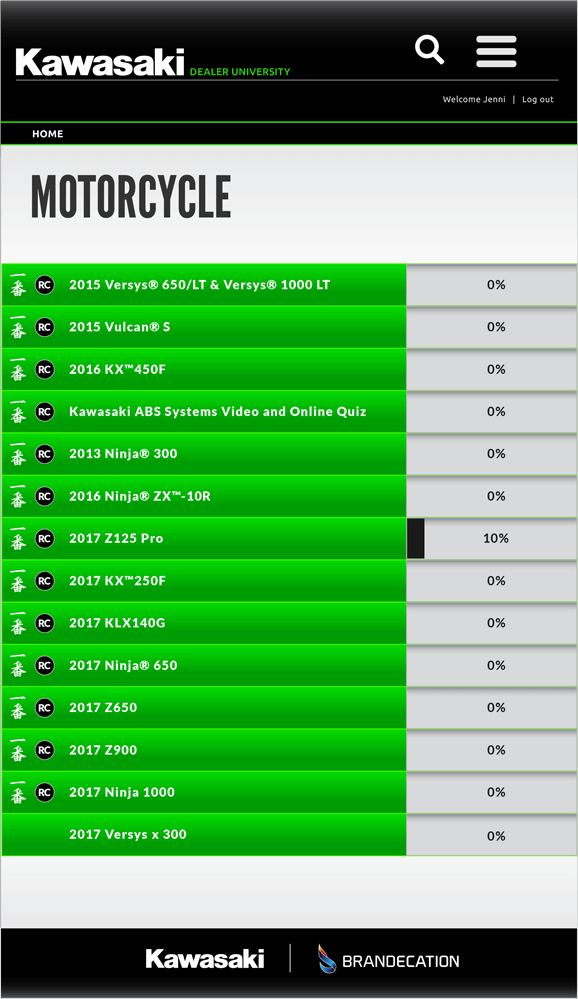
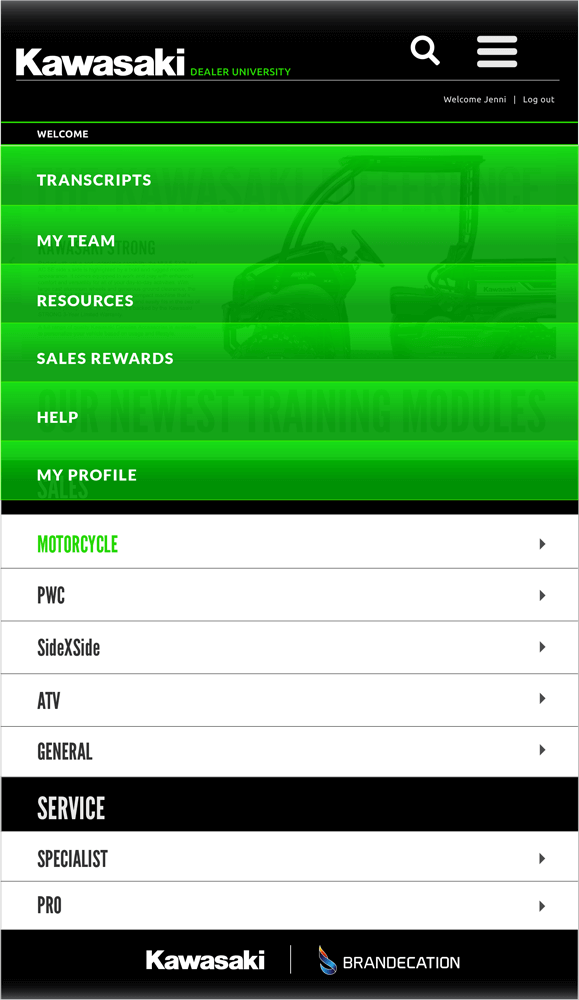
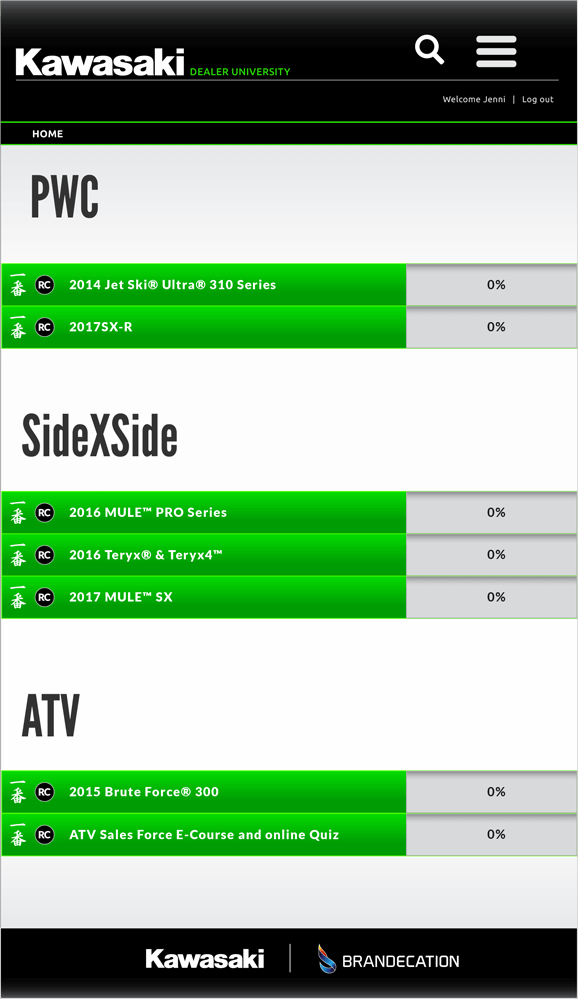
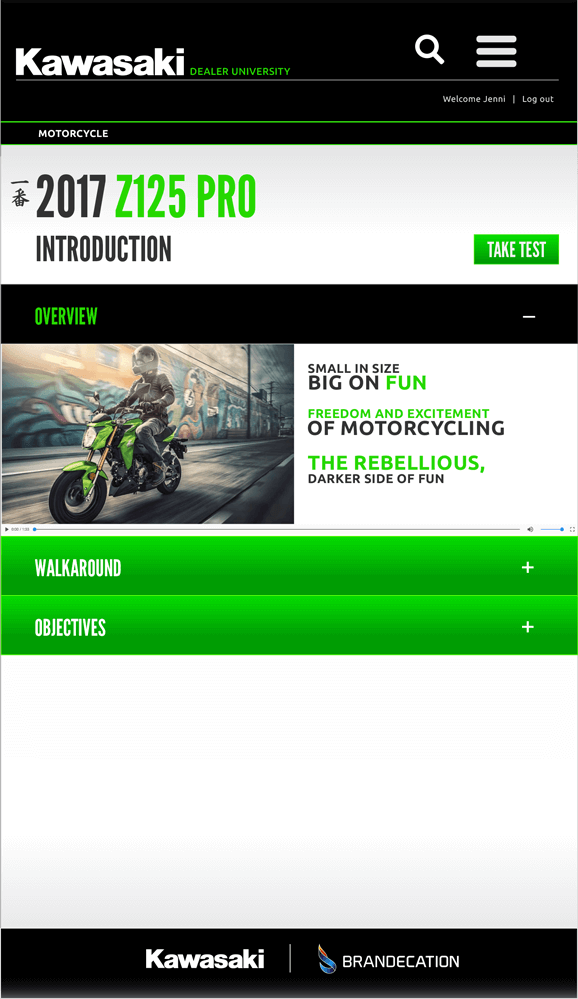
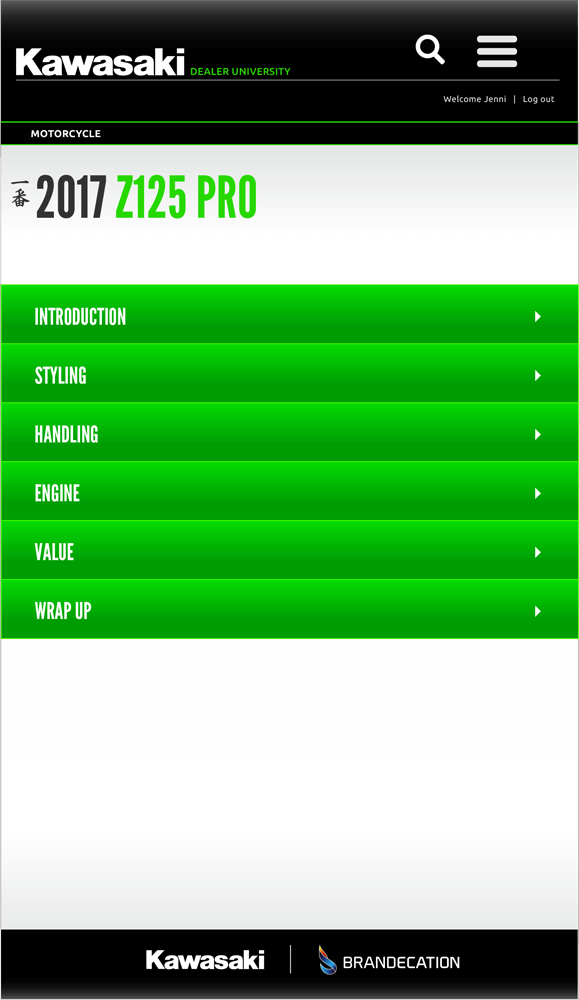
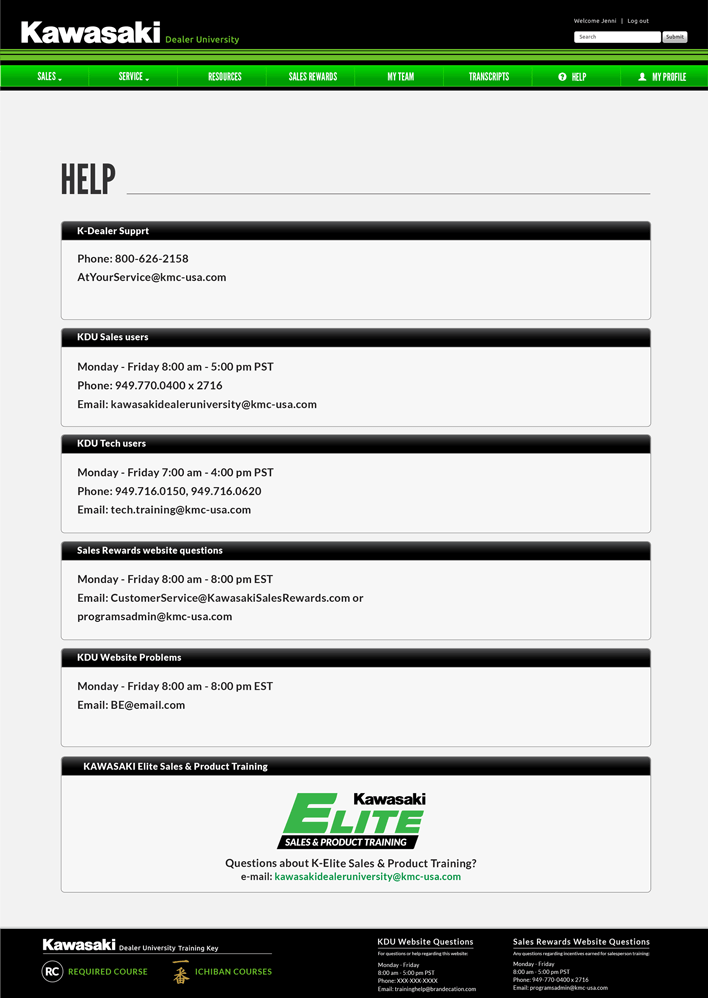
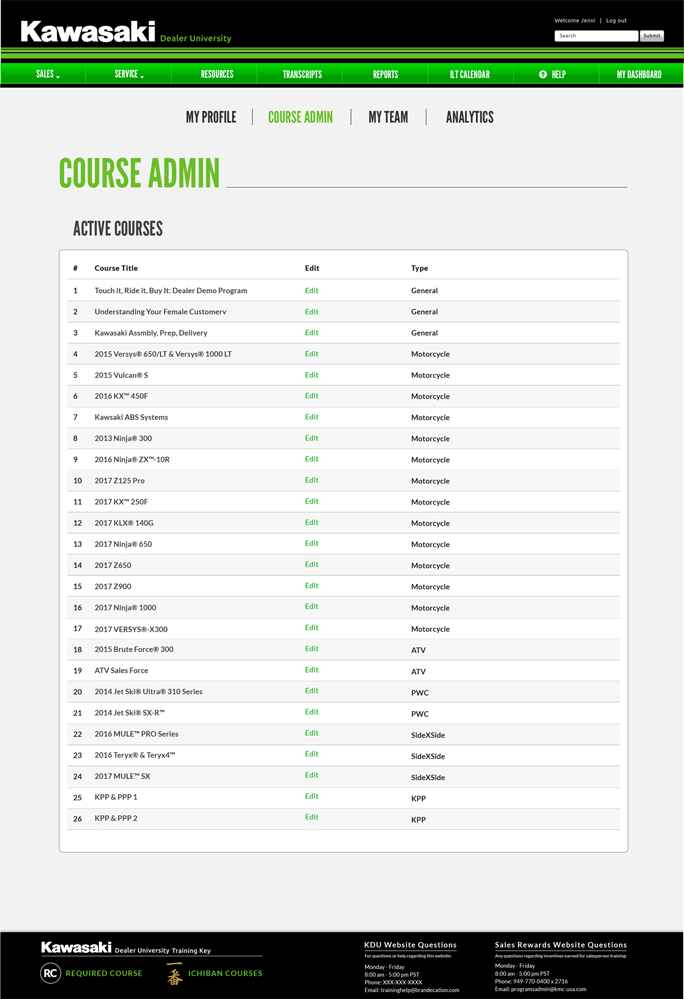
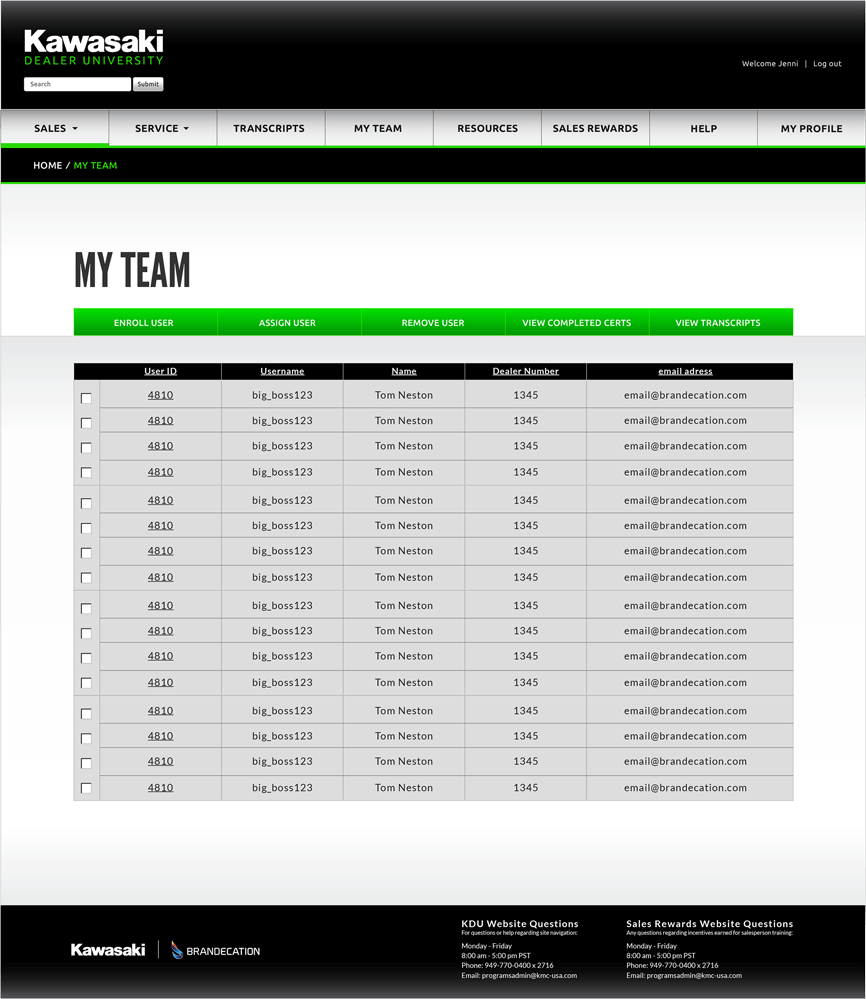
Early Design Mockups
A design mockup is a high-fidelity visual representation of a website, web application, or digital product. It shows how the final product may look — including colors, typography, images, buttons, icons, spacing, and overall visual style.
Unlike rough sketches or wireframes (which focus on layout and functionality), mockups focus on visual design and brand aesthetics.
Show detailed visual styling:
Fonts
Colors
Button styles
Icons
Imagery
Branding elements
How they fit in the process
Mockups are a critical bridge between UX planning and development. They ensure the product is not just functional but also visually appealing, on-brand, and user-friendly. They drastically reduce miscommunication, speed up approvals, and serve as a crucial guide for developers.
Process:
Sitemap: Defines structure.
Sketches: Rough layouts.
Wireframes: Refined structure with placeholders.
Mockups: Full visual design with branding.
Prototype: Clickable, testable version.
Development: Build the actual LMS or website.
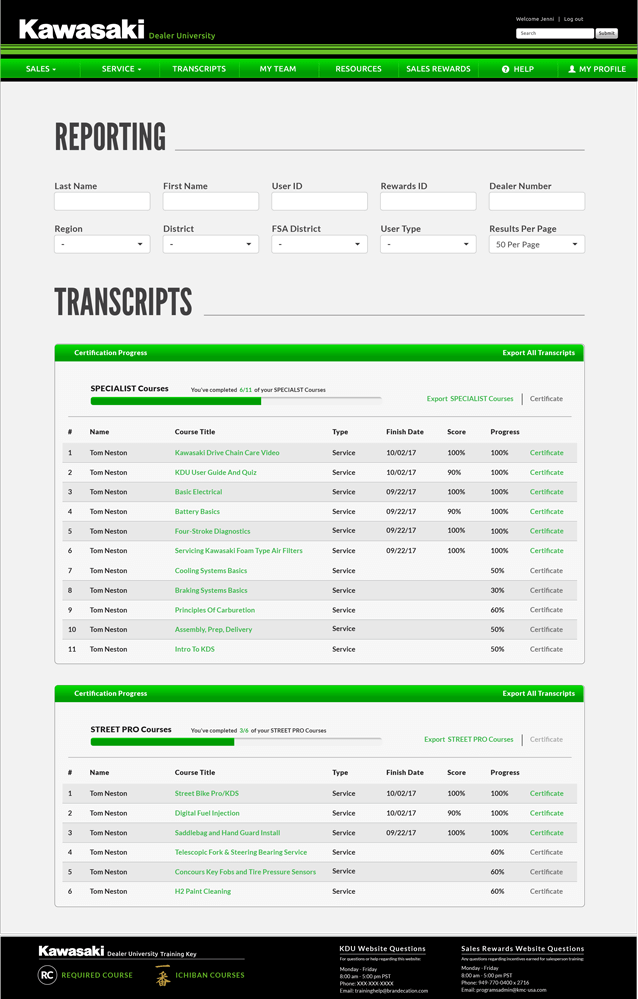
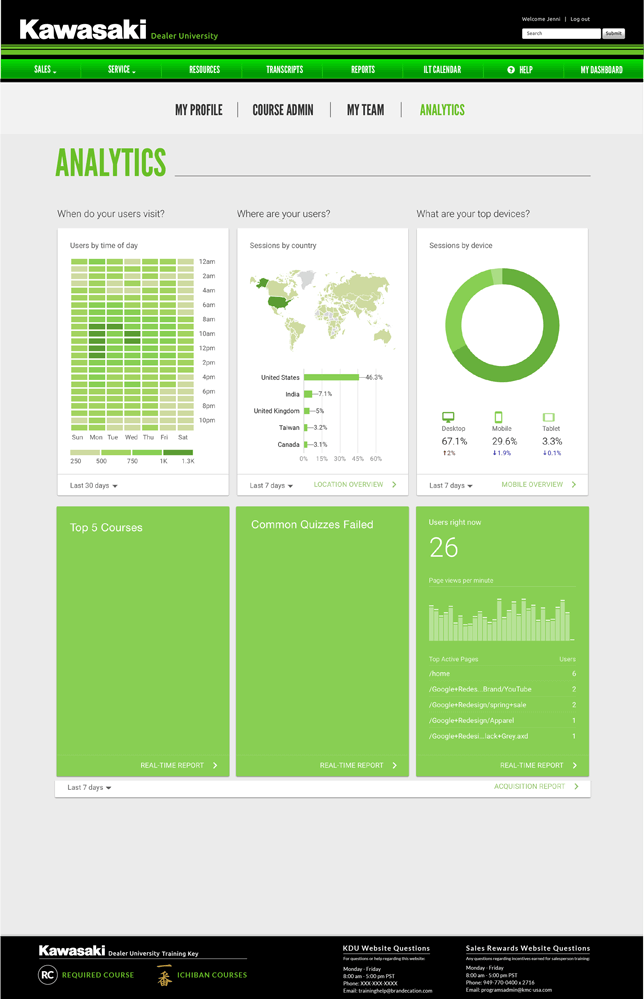
Actionable Analytics & Reporting
Training metrics & analytics refers to the collection, analysis, and interpretation of data related to user behavior, engagement, performance, and outcomes within a Learning Management System (LMS). It transforms raw learner data into actionable insights that help organizations optimize their training programs, measure effectiveness, and improve learner outcomes.
We created real-time insights into the dealer training progress, completion rates, and knowledge retention. Our intuitive reporting dashboard gave administrators the ability to monitor performance metrics and identify opportunities across their entire dealer network.
KDU METRICS & Analytics
Wrap Up
Unlike traditional software solutions, we combined powerful training and rewards technology with white-glove managed services, ensuring the program's success through dedicated account management.
If you’d like to know more or are interested in booking me, please don’t hesitate to reach out.
tom.neston@gmail.com
818-445-1676